Testing · VISUAL GUIDE
OTDR: understanding a fiber link trace
A trace shows how the measured optical signal changes along the fiber.
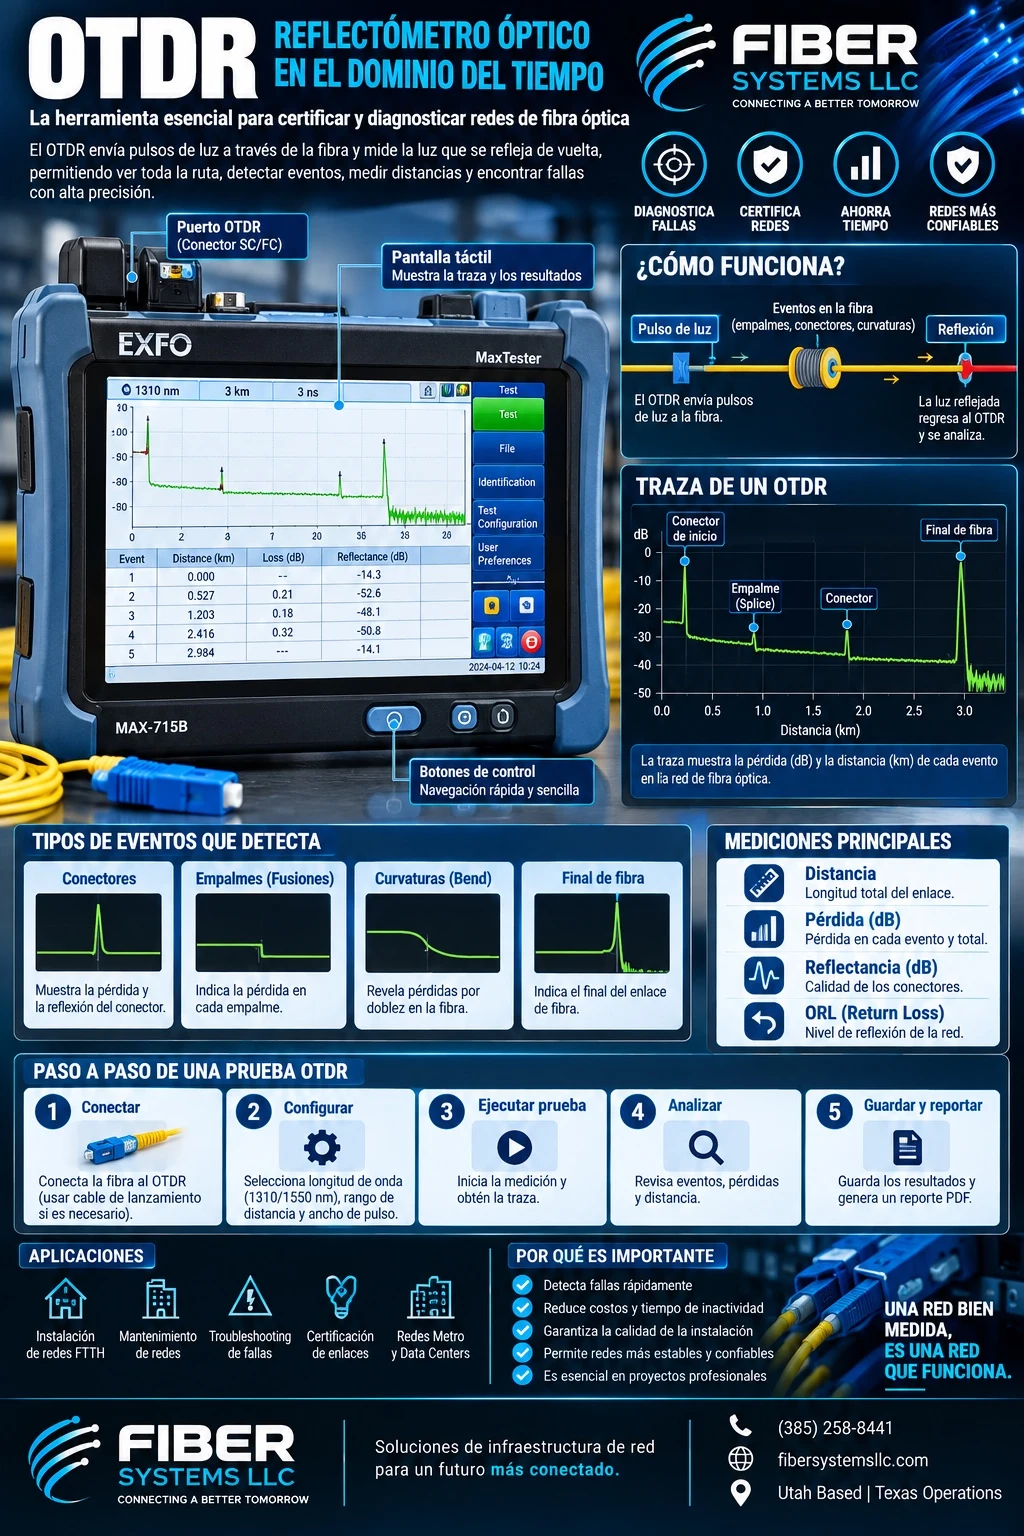
What the image shows
The infographic presents an OTDR, a trace and examples of events. The horizontal axis represents distance, and the curve helps relate signal changes to positions along the link.
Interpret the trace in context
A reflection or drop does not by itself establish a fault's cause. Consider the topology, connectors, splices and test configuration. Different events can look similar.
Save useful results
Record the fiber identification, endpoints, wavelength and settings with the results. Project requirements determine whether launch and receive fibers, bidirectional measurements or additional tests are needed.